
Now…
This is an extensive guide on candlestick patterns (with 3781 words).
So, take your time to digest the materials and come back to it whenever you need a refresher.
Now let’s begin!
What is a candlestick pattern?
Japanese candlestick patterns originated from a Japanese rice trader called, Munehisa Homma during the 1700s.
Almost 300 years later:
It was introduced to the western world by Steve Nison, in his book called, Japanese Candlestick Charting Techniques.
Now, it’s likely the original ideas have been modified which now results in the candlestick patterns you use today.
Anyway, that’s the brief history behind Japanese candlestick patterns.
Moving on…
Let’s learn how to read a candlestick chart…
So, how do you read a Japanese candlestick chart?
Now, every candlestick pattern has 4 data points:
Open – The opening price
High – The highest price over a fixed time period
Low – The lowest price over a fixed time period
Close – The closing price
Here’s what I mean:
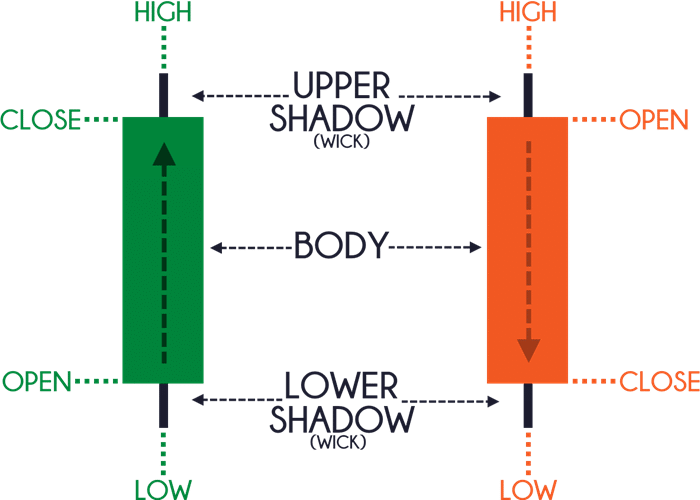
Remember…
For a Bullish candle, the open is always BELOW the close.
For a Bearish candle, the open is always ABOVE the close.
Bullish reversal candlestick patterns
Bullish reversal candlestick patterns signify that buyers are momentarily in control.
However, it doesn’t mean you should go long immediately when you spot such a pattern because it doesn’t offer you an “edge” in the markets.
Instead, you want to combine candlestick patterns with other tools so you can find a high probability trading setup (more on that later).
For now, these are 5 bullish reversal candlestick patterns you should know:
- Hammer
- Bullish Engulfing Pattern
- Piercing Pattern
- Tweezer Bottom
- Morning Star
Let me explain…
Hammer
A Hammer is a (1- candle) bullish reversal pattern that forms after a decline in price.
Here’s how to recognize it:
- Little to no upper shadow
- The price closes at the top ¼ of the range
- The lower shadow is about 2 or 3 times the length of the body
And this is what a Hammer means…
- When the market opens, the sellers took control and pushed price lower
- At the selling climax, huge buying pressure stepped in and pushed price higher
- The buying pressure is so strong that it closed above the opening price
In short, a hammer is a bullish reversal candlestick pattern that shows rejection of lower prices.
Now, just because you see a Hammer doesn’t mean the trend will reverse immediately.
You’ll need more “confirmation” to increase the odds of the trade working out and I’ll cover that in details later.
Moving on…
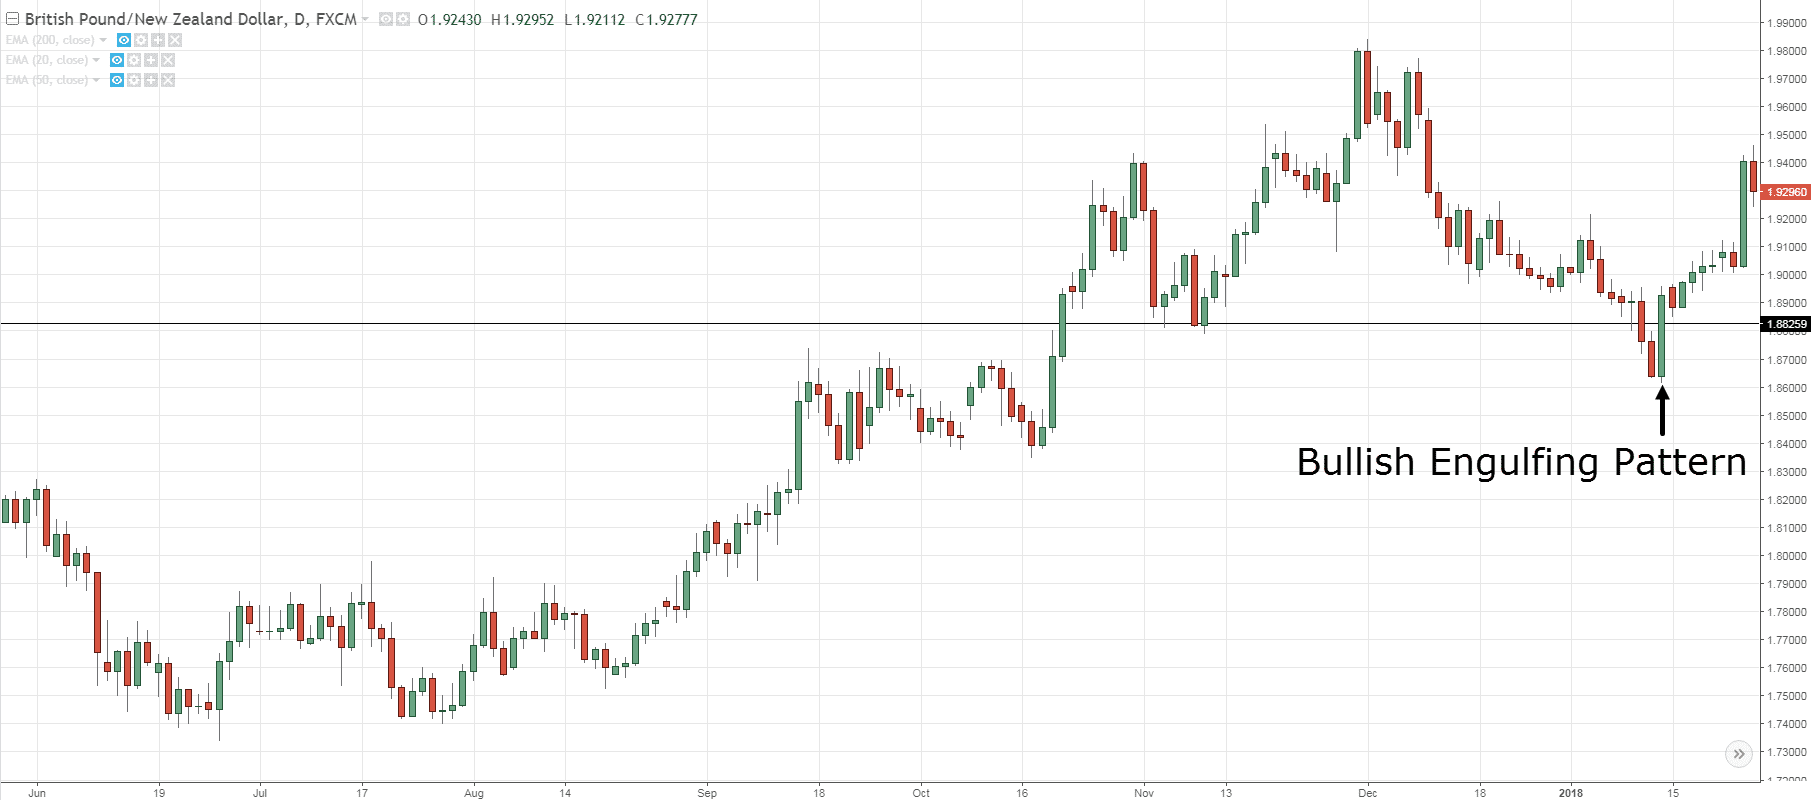
Bullish Engulfing Pattern

A Bullish Engulfing Pattern is a (2-candle) bullish reversal candlestick pattern that forms after a decline in price.
Here’s how to recognize it:
- The first candle has a bearish close
- The body of the second candle completely “covers” the body first candle (without taking into consideration the shadow)
- The second candle closes bullish
And this is what a Bullish Engulfing Pattern means…
- On the first candle, the sellers are in control as they closed lower for the period
- On the second candle, strong buying pressure stepped in and closed above the previous candle’s high — which tells you the buyers have won the battle for now
In essence, a Bullish Engulfing Pattern tells you the buyers have overwhelmed the sellers and are now in control.
And lastly, a Hammer is usually a Bullish Engulfing Pattern on the lower timeframe because of the way candlesticks are formed on multiple timeframes.
If you’re not sure how it works, then go watch this video below…
Next…
Piercing Pattern

A Piercing Pattern is a (2-candle) reversal candlestick pattern that forms after a decline in price.
Unlike the Bullish Engulfing Pattern which closes above the previous open, the Piercing Pattern closes within the body of the previous candle.
Thus in terms of strength, the Piercing Pattern isn’t as strong as the Bullish Engulfing pattern.
Here’s how to recognize it:
- The first candle has a bearish close
- The body of the second candle closes beyond the halfway mark of the first candle
- The second candle closes bullish
And this is what a Piercing Pattern means…
- On the first candle, the sellers are in control as they closed lower for the period
- On the second candle, buying pressure stepped in and it closed bullishly (more than 50% of the previous body) — which tells you there are buying pressure around
Next…
Tweezer Bottom

When I mean Tweezer, I don’t mean the tool you use to pick your nose hair (although it sure looks like it). Instead…
A Tweezer Bottom is a (2-candle) reversal candlestick pattern that occurs after a decline in price.
Here’s how to recognize it:
- The first candle shows rejection of lower prices
- The second candle re-tests the low of the previous candle and closes higher
And this is what a Tweezer Bottom means…
- On the first candle, the sellers pushed price lower and were met with some buying pressure
- On the second candle, the sellers again tried to push price lower but failed, and was finally overwhelmed by strong buying pressure
In short, a Tweezer Bottom tells you the market has difficulty trading lower (after two attempts) and it’s likely to head higher.
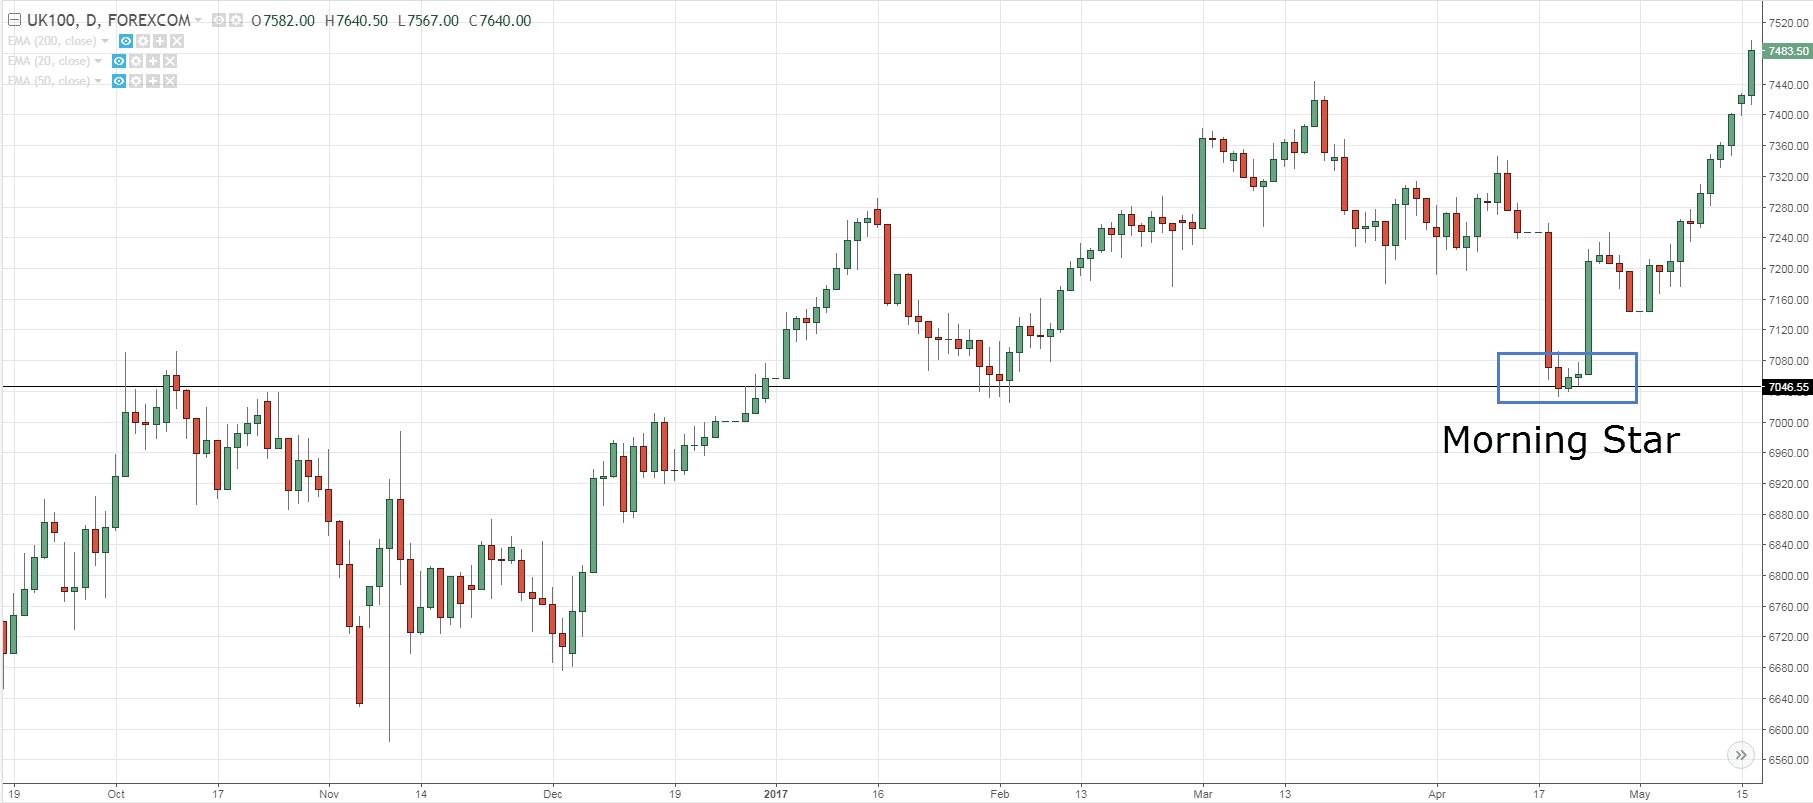
Morning Star

A Morning Star is a (3-candle) bullish reversal candlestick pattern that forms after a decline in price.
Here’s how to recognize it:
- The first candle has a bearish close
- The second candle has a small range
- The third candle closes aggressively higher (more than 50% of the first candle)
And this is what a Morning Star means…
- On the first candle shows, the sellers are in control as the price closes lower
- On the second candle, there is indecision in the markets as both the selling and buying pressure are in equilibrium (that’s why the range of the candle is small)
- On the third candle, the buyers won the battle and the price closes higher
In short, a Morning Star tells you the sellers are exhausted and the buyers are momentarily in control.
Moving on…
How to find high probability bullish reversal setups
Great!
You’ve learned the different bullish reversal candlestick patterns.
Now, let’s take it a step further and learn how to identify high probability trading setups with it.
Recall:
You don’t want to trade any candlestick patterns in isolation because it doesn’t offer an “edge” in the markets.
So here’s how you do it…
- If the market is trending higher, then wait for a pullback towards Support
- If the price makes a pullback towards Support, then wait for a bullish reversal candlestick pattern
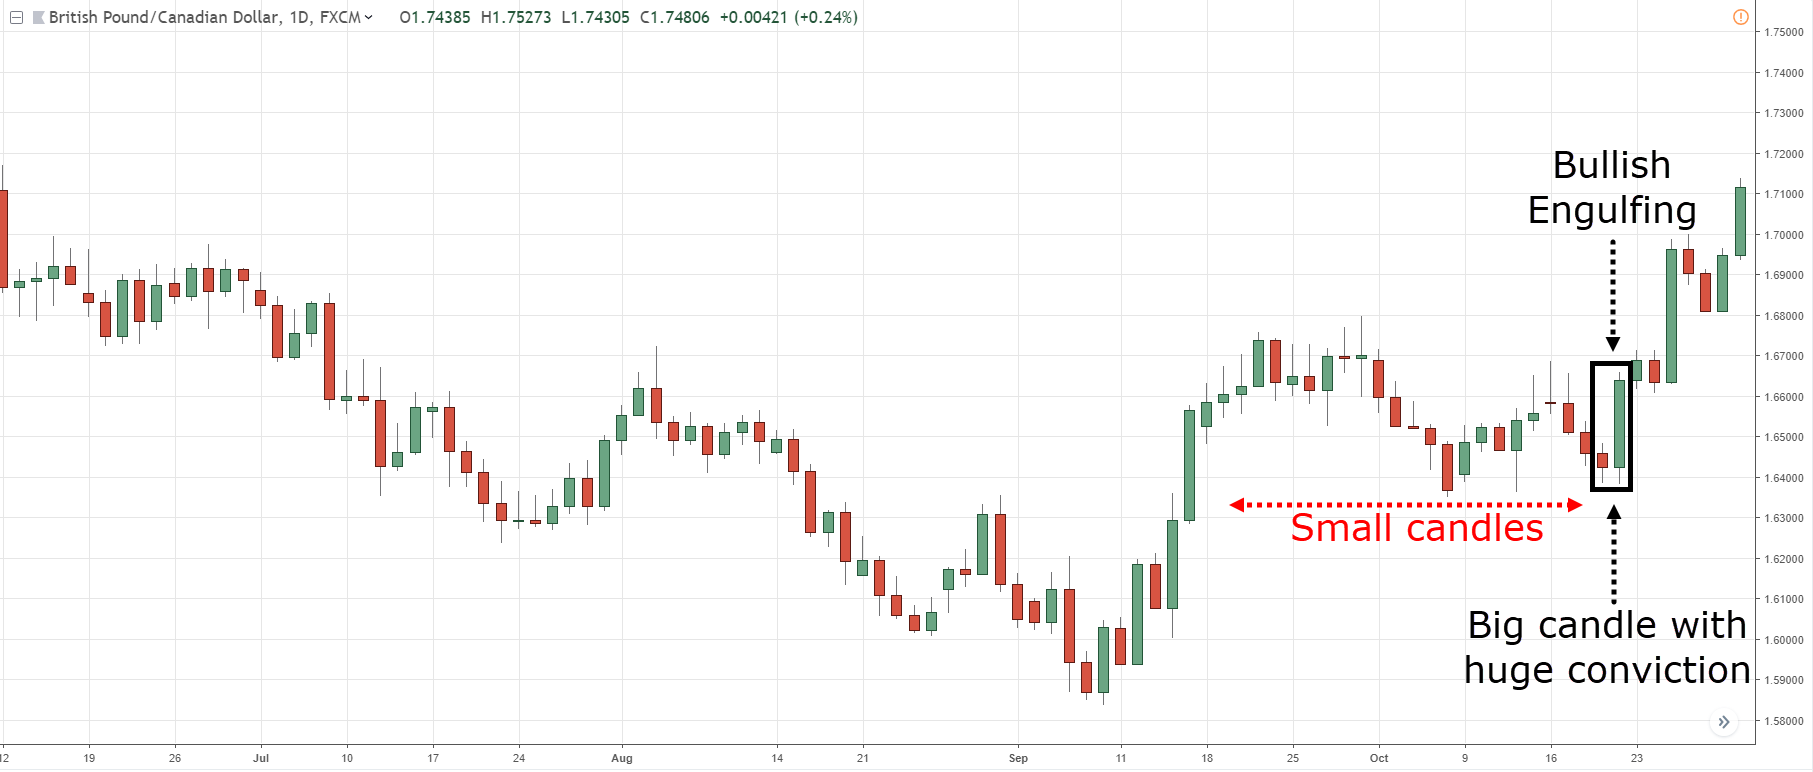
- If there’s a bullish reversal candlestick pattern, then make sure the size of it is larger than the earlier candles (signalling strong rejection)
Here are a few cherry-picked examples:
Morning Star:
Bullish Engulfing Pattern:
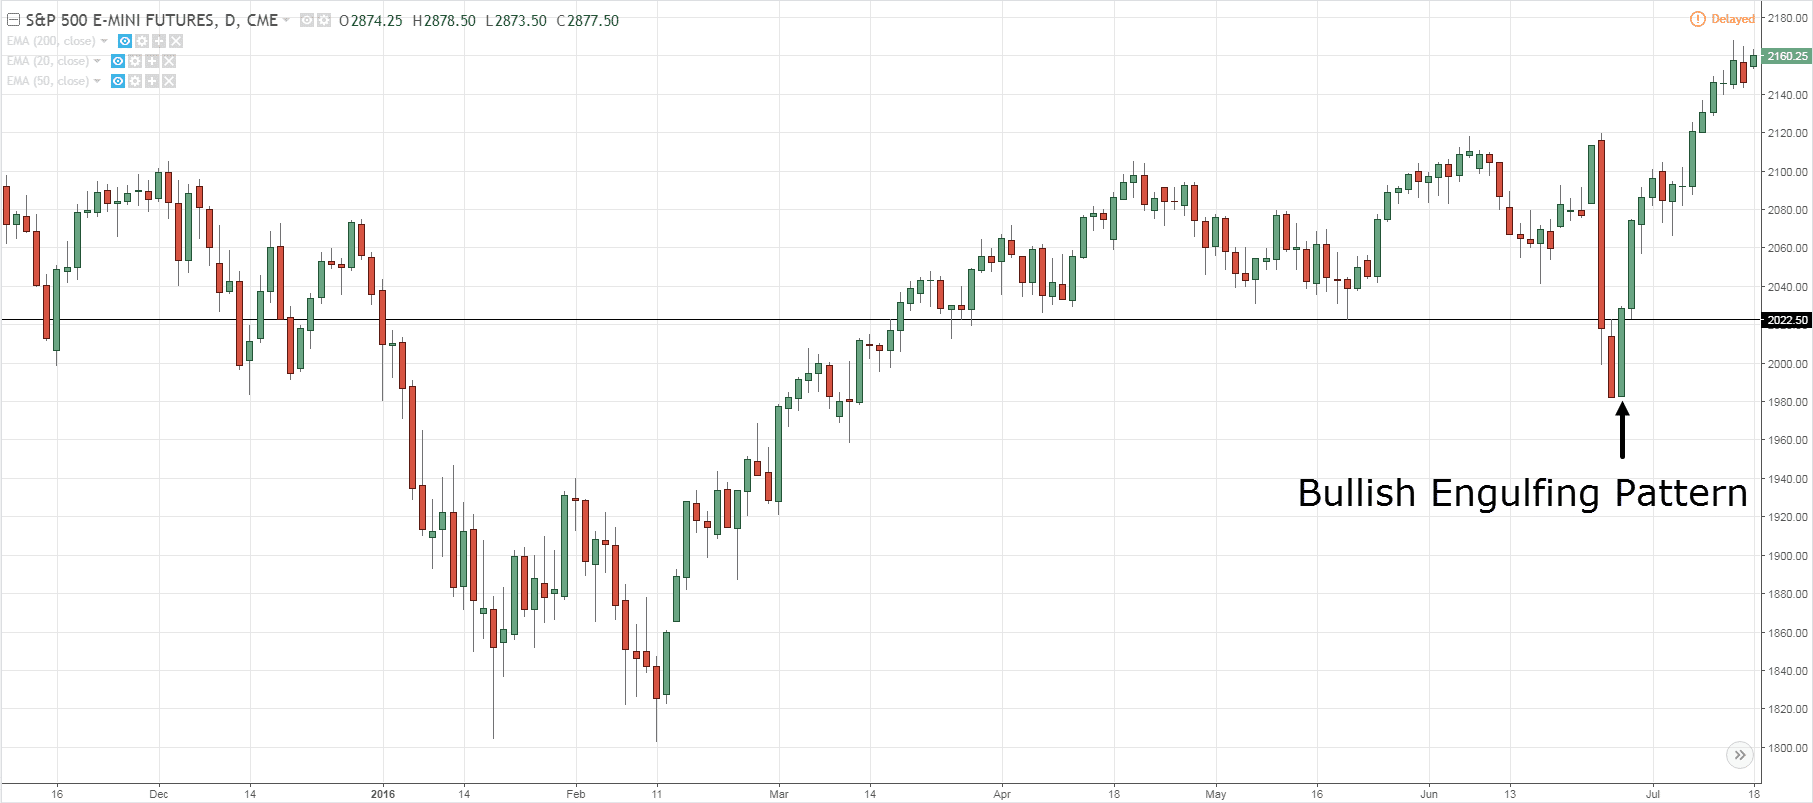
Bullish Engulfing Pattern:
Note: There will be losing trades as well and this is not the “holy grail”.
Now, let’s move on…
Bearish reversal candlestick patterns
Bearish reversal candlestick patterns signify that sellers are momentarily in control.
Likewise, it doesn’t mean you should go short immediately when you spot such a pattern because it doesn’t offer you an “edge” in the markets.
Instead, you want to combine candlestick patterns with other tools so you can find a high probability trading setup.
For now, these are 5 bearish reversal candlestick patterns you should know:
- Shooting Star
- Bearish Engulfing Pattern
- Dark Cloud Cover
- Tweezer Top
- Evening Star
Let me explain…
Shooting Star

A Shooting Star is a (1- candle) bearish reversal pattern that forms after an advanced in price.
Here’s how to recognize it:
- Little to no lower shadow
- The price closes at the bottom ¼ of the range
- The upper shadow is about 2 or 3 times the length of the body
And this is what a Shooting Star means…
- When the market opens, the buyers took control and pushed price higher
- At the buying climax, huge selling pressure stepped in and pushed price lower
- The selling pressure is so strong that it closed below the opening price
In short, a Shooting Star is a bearish reversal candlestick pattern that shows rejection of higher prices.
Now, just because you see a Shooting Star doesn’t mean the trend will reverse immediately.
You’ll need more “confirmation” to increase the odds of the trade working out and I’ll cover that in details later.
Moving on…
Bearish Engulfing Pattern

A Bearish Engulfing Pattern is a (2-candle) bearish reversal candlestick pattern that forms after an advanced in price.
Here’s how to recognize it:
- The first candle has a bullish close
- The body of the second candle completely “covers” the body first candle (without taking into consideration the shadow)
- The second candle closes bearish
And this is what a Bearish Engulfing Pattern means…
- On the first candle, the buyers are in control as they closed higher for the period
- On the second candle, strong selling pressure stepped in and closed below the previous candle’s low — which tells you the sellers have won the battle for now
In essence, a Bearish Engulfing Pattern tells you the sellers have overwhelmed the buyers and are now in control.
Dark Cloud Cover

A Dark Cloud Cover is a (2-candle) reversal candlestick pattern that forms after an advanced in price.
Unlike the Bearish Engulfing Pattern which closes below the previous open, the Dark Cloud Cover closes within the body of the previous candle.
Thus in terms of strength, the Dark Cloud Cover isn’t as strong as the Bearish Engulfing pattern.
Here’s how to recognize it:
- The first candle has a bullish close
- The body of the second candle closes beyond the halfway mark of the first candle
- The second candle closes bearish
And this is what a Dark Cloud Cover means…
- On the first candle, the buyers are in control as they closed higher for the period
- On the second candle, selling pressure stepped in and it closed bearishly (more than 50% of the previous body) — which tells you there are selling pressure around
Next…
Tweezer Top

A Tweezer Top is a (2-candle) reversal candlestick pattern that occurs after an advanced in price.
Here’s how to recognize it:
- The first candle shows rejection of higher prices
- The second candle re-tests the high of the previous candle and closes lower
And this is what a Tweezer Top means…
- On the first candle, the buyers pushed the price higher and were met with some selling pressure
- On the second candle, the buyers again tried to push the price higher but failed, and was finally overwhelmed by strong selling pressure
In short, a Tweezer Top tells you the market has difficulty trading higher (after two attempts) and it’s likely to head lower.
Evening Star

An Evening Star is a (3-candle) bearish reversal candlestick pattern that forms after an advanced in price.
Here’s how to recognize it:
- The first candle has a bullish close
- The second candle has a small range
- The third candle closes aggressively lower (more than 50% of the first candle)
And this is what an Evening Star means…
- On the first candle, it shows the buyers are in control as the price closes higher
- On the second candle, there is indecision in the markets as both the selling and buying pressure are in equilibrium (that’s why the range of the candle is small)
- On the third candle, the sellers won the battle and the price closes lower
In short, an Evening Star tells you the buyers are exhausted and the sellers are momentarily in control.
Moving on…
How to find high probability bearish reversal setups
Awesome!
You’ve just learned the different bearish reversal candlestick patterns.
Now, let’s take it a step further and learn how to identify high probability trading setups with it.
Here’s how you do it…
- If the market is trending lower, then wait for a pullback towards Resistance
- If the price pullback towards Resistance, then wait for a bearish reversal candlestick pattern
- If there’s a bearish reversal candlestick pattern, then make sure the size of it is larger than the earlier candles (signalling strong rejection)
- If there’s a strong price rejection, then go short on next candle’s open
- And vice versa for long setups
Here are a few cherry-picked examples:
Bearish Engulfing Pattern:
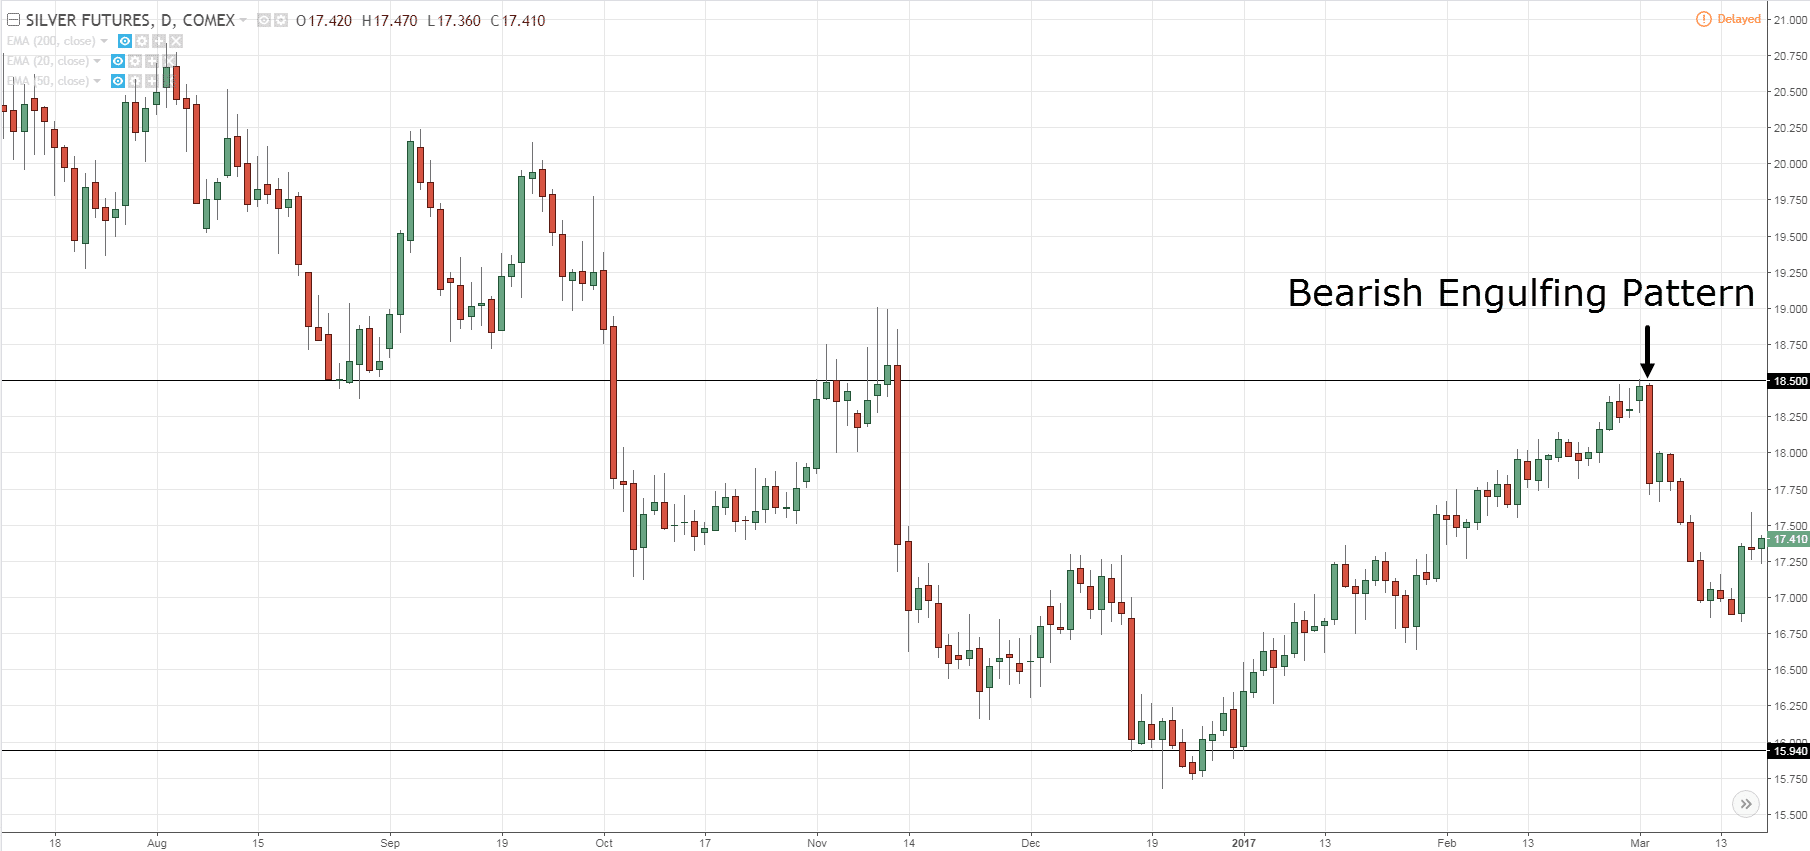
Bearish Engulfing Pattern:
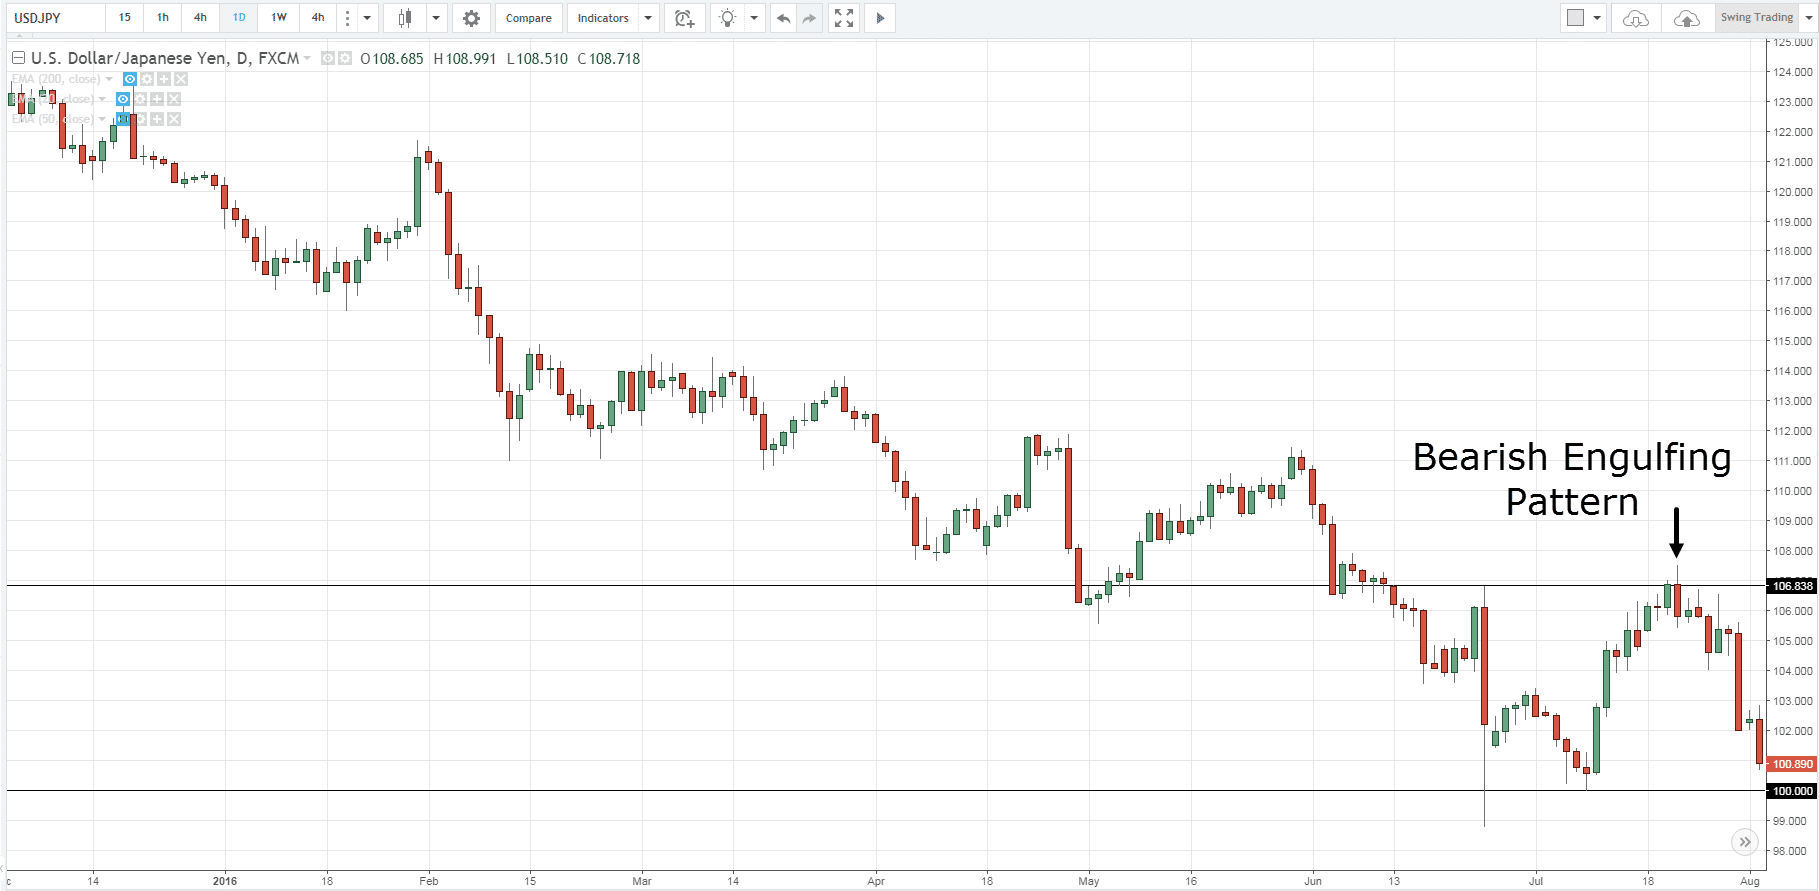
Shooting Star:
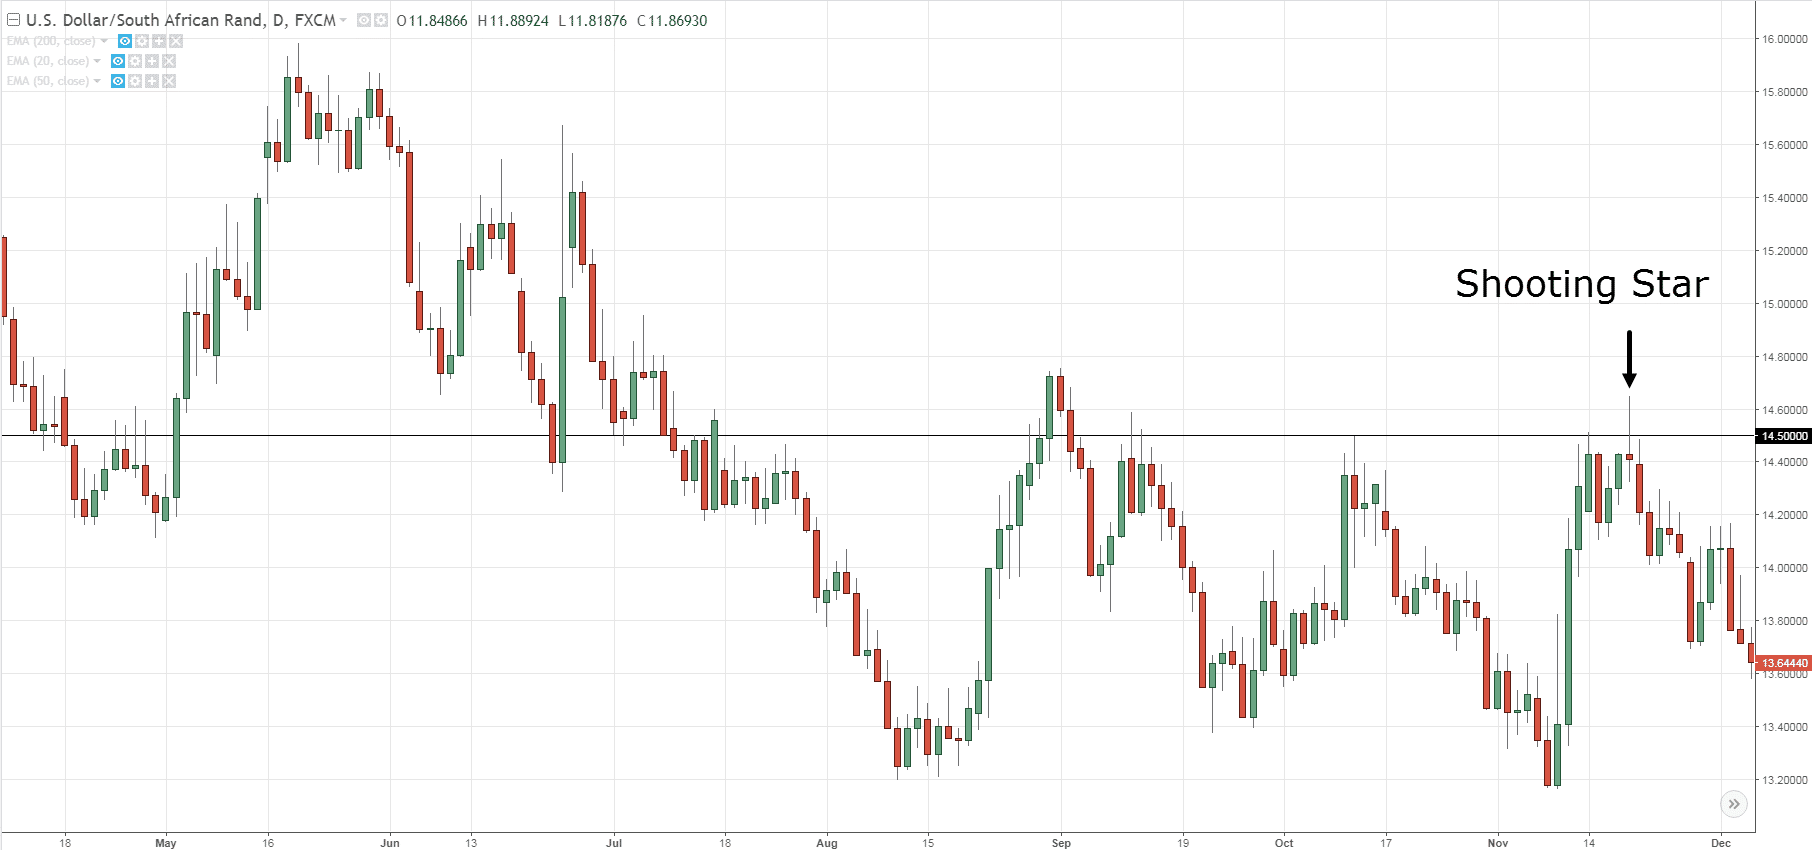
Note: There will be losing trades as well and this is not the “holy grail”.
Indecision candlestick patterns
Indecision candlestick patterns signify that both buying and selling pressure is in equilibrium.
And these are 2 indecision candlestick patterns you should know:
- Spinning top
- Doji
Let me explain…
Spinning top

A spinning top is an indecision candlestick pattern that where both buying and selling pressure is fighting for control.
Here’s how to recognize it:
- The candle has long upper and lower shadow
- The candle has a small body
And here’s what a Spinning top means…
- When the market opens, both the buyers and sellers aggressively tried to gain control (which results in upper and lower shadows)
- At the end of the session, neither has gained the upper hand (which results in a small body)
In short, a spinning top shows significant volatility in the market but with no clear winner.
And yes, it looks like the toy you played when you were young.

Moving on…
Doji

A Doji represents indecision in the markets as both buying and selling pressure are in equilibrium.
Here’s how to recognize it:
- The candle’s open and close are around the middle of the range
- The upper and lower shadows are short and about the same length
Although Doji is an indecision candlestick pattern, there are variations with different significance.
They are:
- Dragonfly Doji
- Gravestone Doji
I’ll explain…
1. Dragonfly Doji

Unlike a regular Doji which open and close near the middle of the range, the Dragonfly Doji open and close near the highs of the range with long lower shadow.
This tells you there is a rejection of lower prices as buying pressure stepped in and pushed the market higher towards the opening price.
2. Gravestone Doji

Unlike a regular Doji which open and close near the middle of the range, the Gravestone Doji closes open and close near the lows of the range with long upper shadow.
This tells you there is a rejection of higher prices as selling pressure stepped in and pushed the market lower towards the opening price.
Moving on…
Continuation candlestick patterns
Continuation candlestick patterns signify the market is likely to continue trading in the same direction.
And if you’re a trend trader, these candlestick patterns present some of the best trading opportunities out there.
So here are 4 continuation patterns you should know:
- Rising Three Method
- Falling Three Method
- Bullish Harami
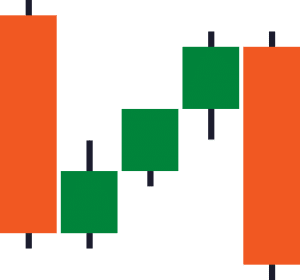
- Bearish Harami
Let me explain…
Rising Three Method
The Rising Three Method is a bullish trend continuation pattern that signals the market is likely to continue trending higher.
Here’s how to recognize it:
- The first candle is a large bullish candle
- The second, third and fourth candle has a smaller range and body
- The fifth candle is a large-bodied candle that closes above the highs of the first candle
And here’s what a Rising Three Method means…
- On the first candle, it shows the buyers are in domination as they closed the session strongly
- On the second, third, and fourth candle, buyers are taking profits which led to a slight decline. However, it’s not a strong selloff as there are new buyers entering long at these prices
- On the fifth candle, the buyers regain control and pushed the price to new highs
Note: If you’re familiar with western charting, you’d realized the Bullish Flag and Rising Three Method pretty much mean the same thing.
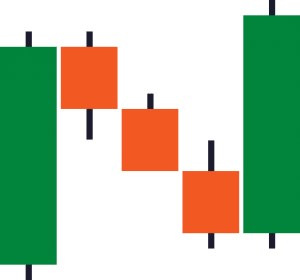
Falling Three Method
The Falling Three Method is a bearish trend continuation pattern that signals the market is likely to continue trending lower.
Here’s how to recognize it:
- The first candle is a large bearish candle
- The second, third and fourth candle has a smaller range and body
- The fifth candle is a large-bodied candle that closes below the lows of the first candle
And here’s what a Falling Three Method means…
- On the first candle, it shows the sellers are in domination as they closed the session strongly lower
- On the second, third, and fourth candle, sellers are taking profits which led to a slight advanced. However, it’s not a strong rally as there are new sellers entering short at these prices
- On the fifth candle, the sellers regain control and pushed the price to new lows
Next…
Bullish Harami

Here’s the deal:
Most trading websites or books will tell you the Bullish Harami occurs after a decline in price.
But I can’t agree.
This is one of those things you must use common sense to filter out the BS out there.
Think about this:
A downtrend is created using the prices of the few hundred candlesticks.
Do you think it will reverse because a Bullish Harami is formed?
Unlikely.
Instead, the Bullish Harami works best as a continuation pattern in an uptrend.
It signals the buyers are “taking a break” and the price is likely to trade higher.
Moving on…
Here’s how you recognize a Bullish Harami:
- The first candle is bullish and larger than the second candle
- The second candle has a small body and range (it can be bullish or bearish)
And here’s what a Bullish Harami means…
- On the first candle, it shows strong buying pressure as the candle closes bullishly
- On the second candle, it shows indecision as both buying and selling pressure is similar (likely because of traders taking profits and new traders entering long positions)
Note: You can treat the Harami as an Inside Bar. They mean the same thing and can be traded in a similar context.
Bearish Harami

A bearish Harami works best as a continuation pattern in a downtrend.
It signals the sellers are “taking a break” and the price is likely to trade lower.
Here’s how you recognize a Bearish Harami:
- The first candle is bearish and larger than the second candle
- The second candle has a small body and range (it can be bullish or bearish)
And here’s what a Bearish Harami means…
- On the first candle, it shows strong selling pressure as the candle closes bearishly
- On the second candle, it shows indecision as both buying and selling pressure is similar (likely because of traders taking profits and new traders entering short positions)
Let’s move on…
How to find high probability trend continuation setups
So…
You’ve learned what are continuation candlestick patterns and how it looks like.
Now, I’ll teach you how to identify high probability trading setups with these patterns.
Here’s how to do it…
- If the market is in a range, then wait for it to breakout out of Resistance
- If the market breaks out of Resistance, then wait for it to form a continuation candlestick pattern (like Rising Three Method or Bullish Harami)
- If the market forms a continuation candlestick pattern, then go long on the break of the highs
- And vice versa for short setups
Here are a few cherry-picked examples:
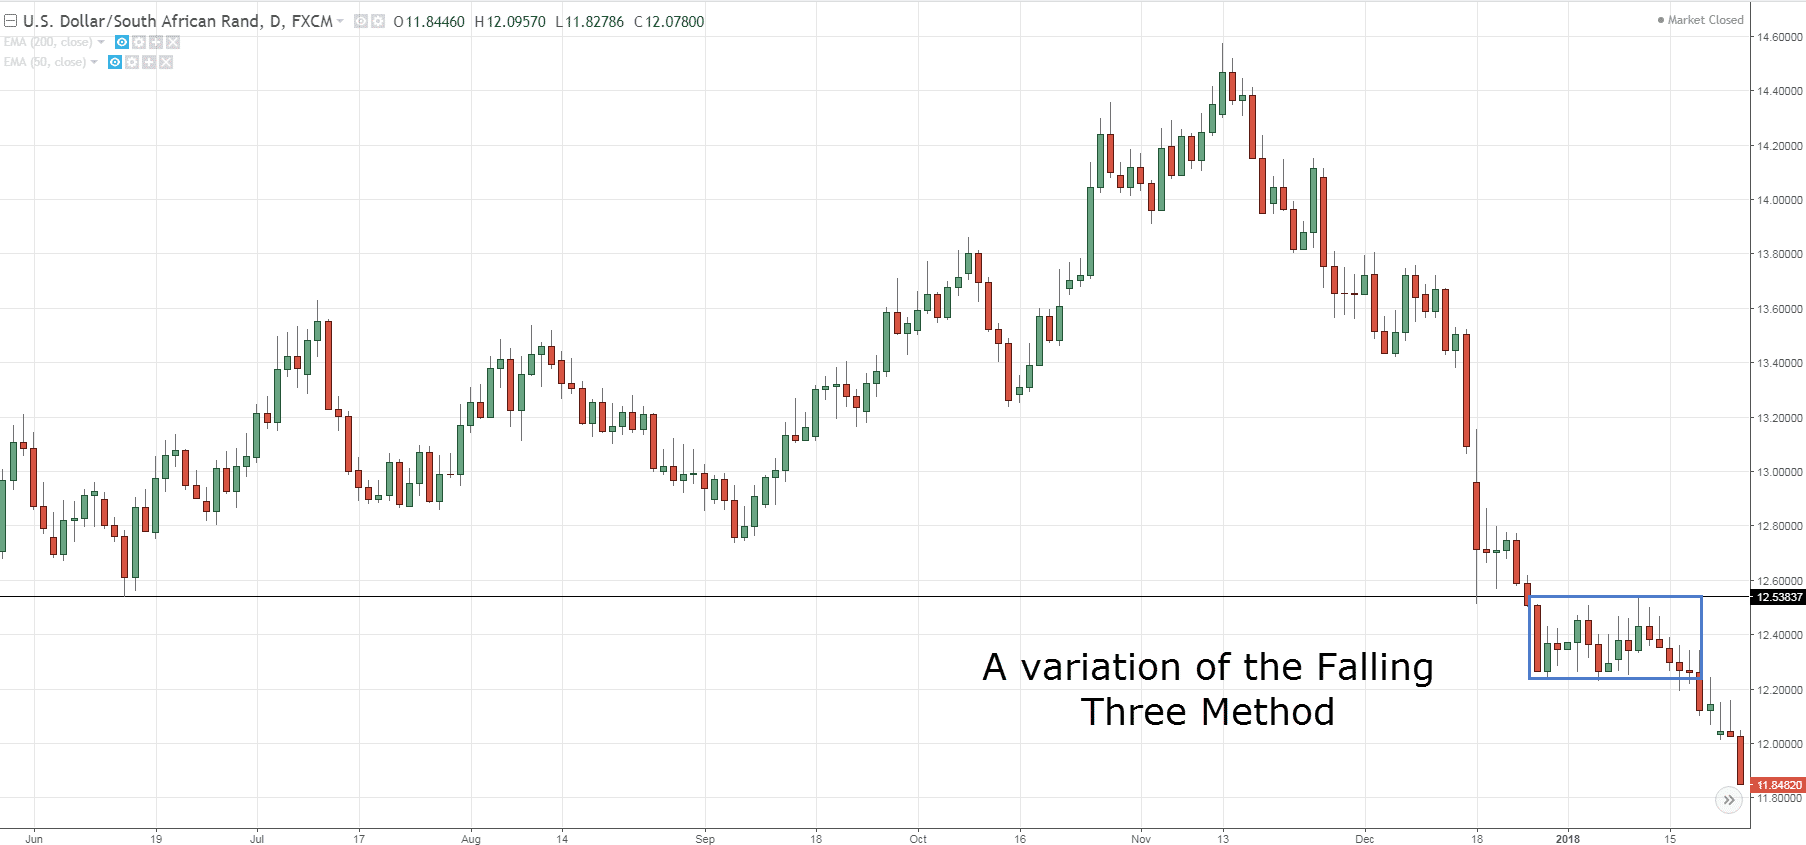
A variation of the Falling Three Method on USD/ZAR:
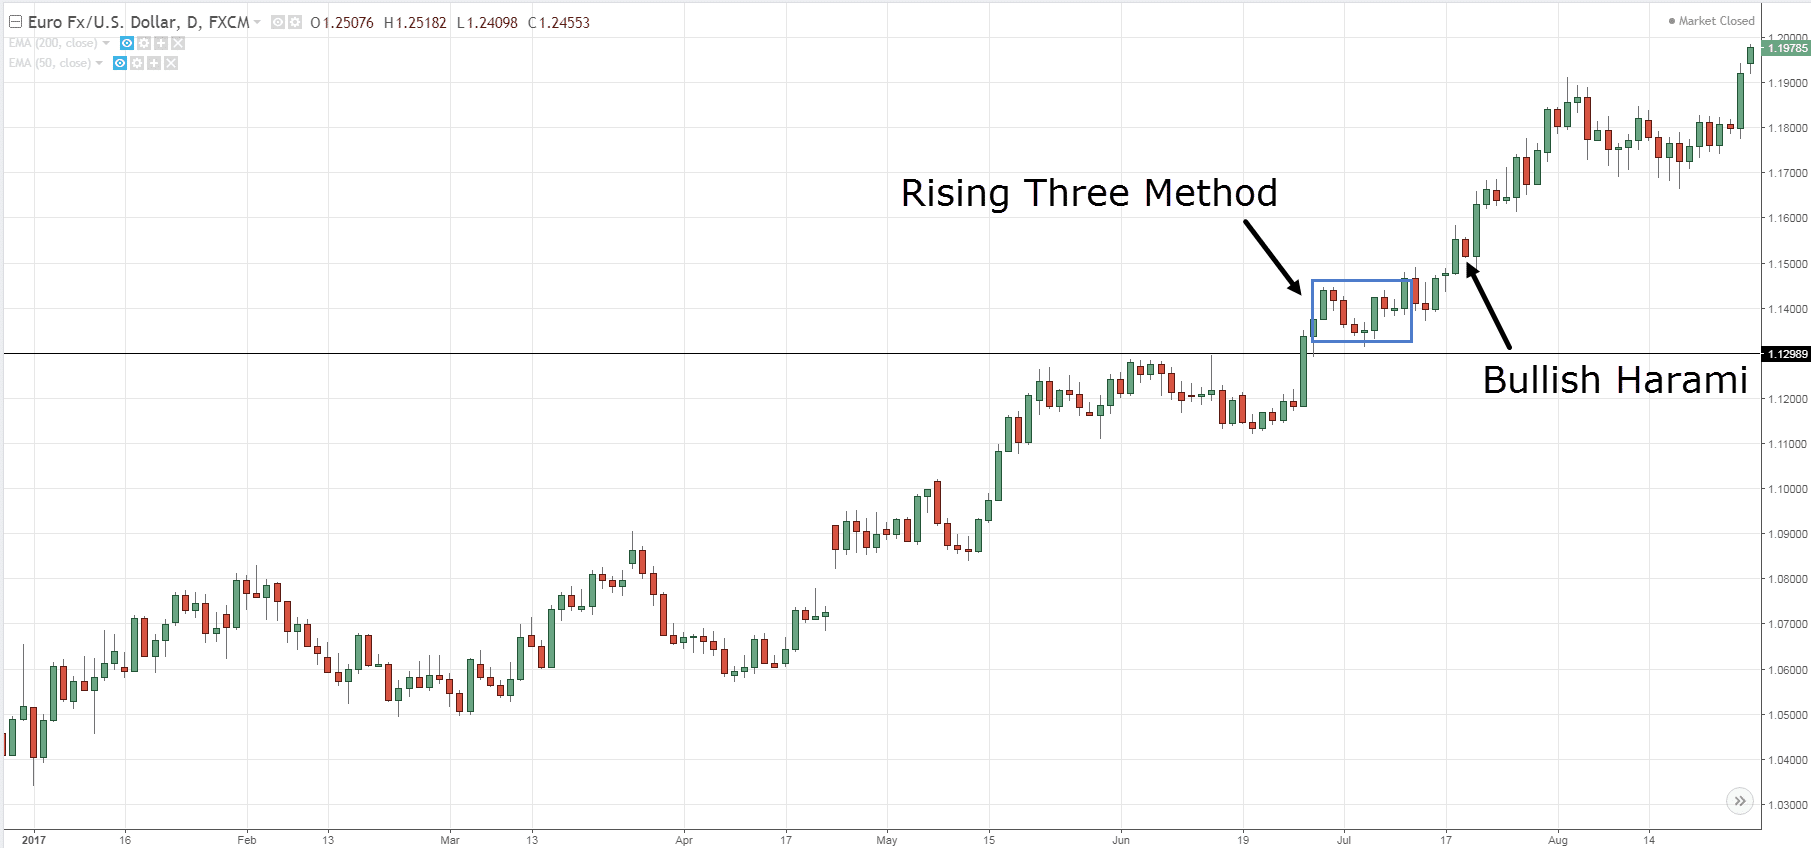
Rising Three Method and Bullish Harami on EUR/USD:
This is powerful stuff, right?
Great!
Let’s move on…
Candlestick patterns cheat sheet: How to understand any candlestick pattern without memorizing a single one
You’re probably wondering:
“Gosh!”
“There are so many candlestick patterns. How do I remember all of them?”
Well, you don’t have to.
Because if you understand the 2 things I’m about to share with you, then you read any candlestick patterns like a pro (think of it like a candlestick pattern cheat sheet).
Here’s what you must know…
- Where did the price close relative to the range?
- What’s the size of the pattern relative to the other candlestick patterns?
Let me explain…
1. Where did the price close relative to the range?
This question lets you know who’s in control momentarily.
Look at this candlestick pattern…
Let me ask you…
Who’s in control?
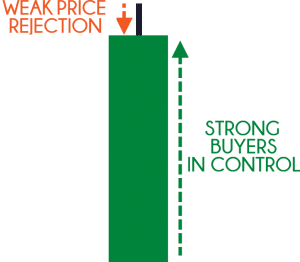
Well, the price closed the near highs of the range which tells you the buyers are in control.
Now, look at this candlestick pattern…
Who’s in control?
Although it’s a bullish candle the sellers are actually the ones in control.
Why?
Because the price closed near the lows of the range and it shows you rejection of higher prices.
So remember, if you want to know who’s in control, ask yourself…
Where did the price close relative to the range?
Next…
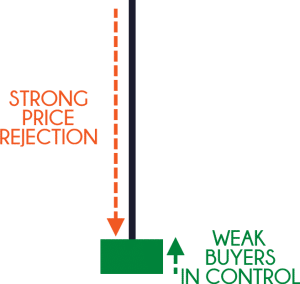
2. What’s the size of the pattern relative to the other candlestick patterns?
This question lets you know if there’s any strength (or conviction) behind the move.
What you want to do is compare the size of the current candle to the earlier candles.
If the current candle is much larger (like 2 times or more), it tells you there’s strength behind the move.
Here’s an example…
And if there’s no strength behind the move, the size of the current candle is about the same size as the earlier ones.
An example…
Does it make sense?
Great!
Now you have what it takes to read any candlestick pattern without memorizing a single one.
Bonus: How to read candlestick chart and “predict” market turning points with deadly accuracy
Here’s the thing:
The market doesn’t move in one straight line.
Instead, it goes…
Up and down, up and down, up and down, right? (Something like that)
And you can classify this “up and down” pattern into:
- Trending move
- Retracement move
This is important, so let me explain…
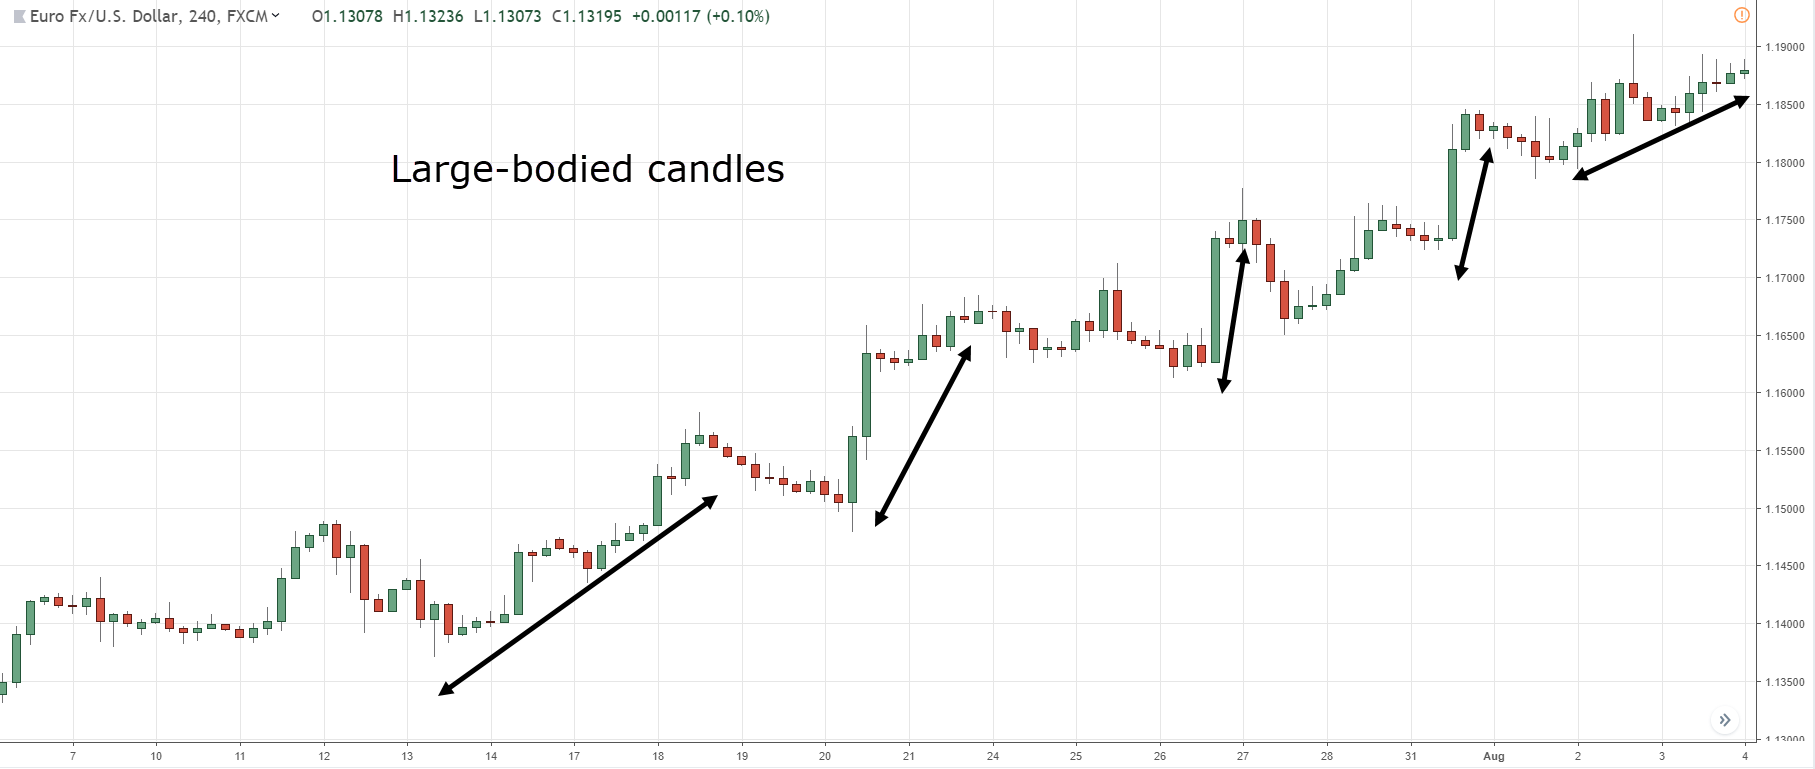
Trending move
A trending move is the “stronger” leg of the trend.
You’ll notice larger-bodied candles that move in the direction of the trend.
An example:
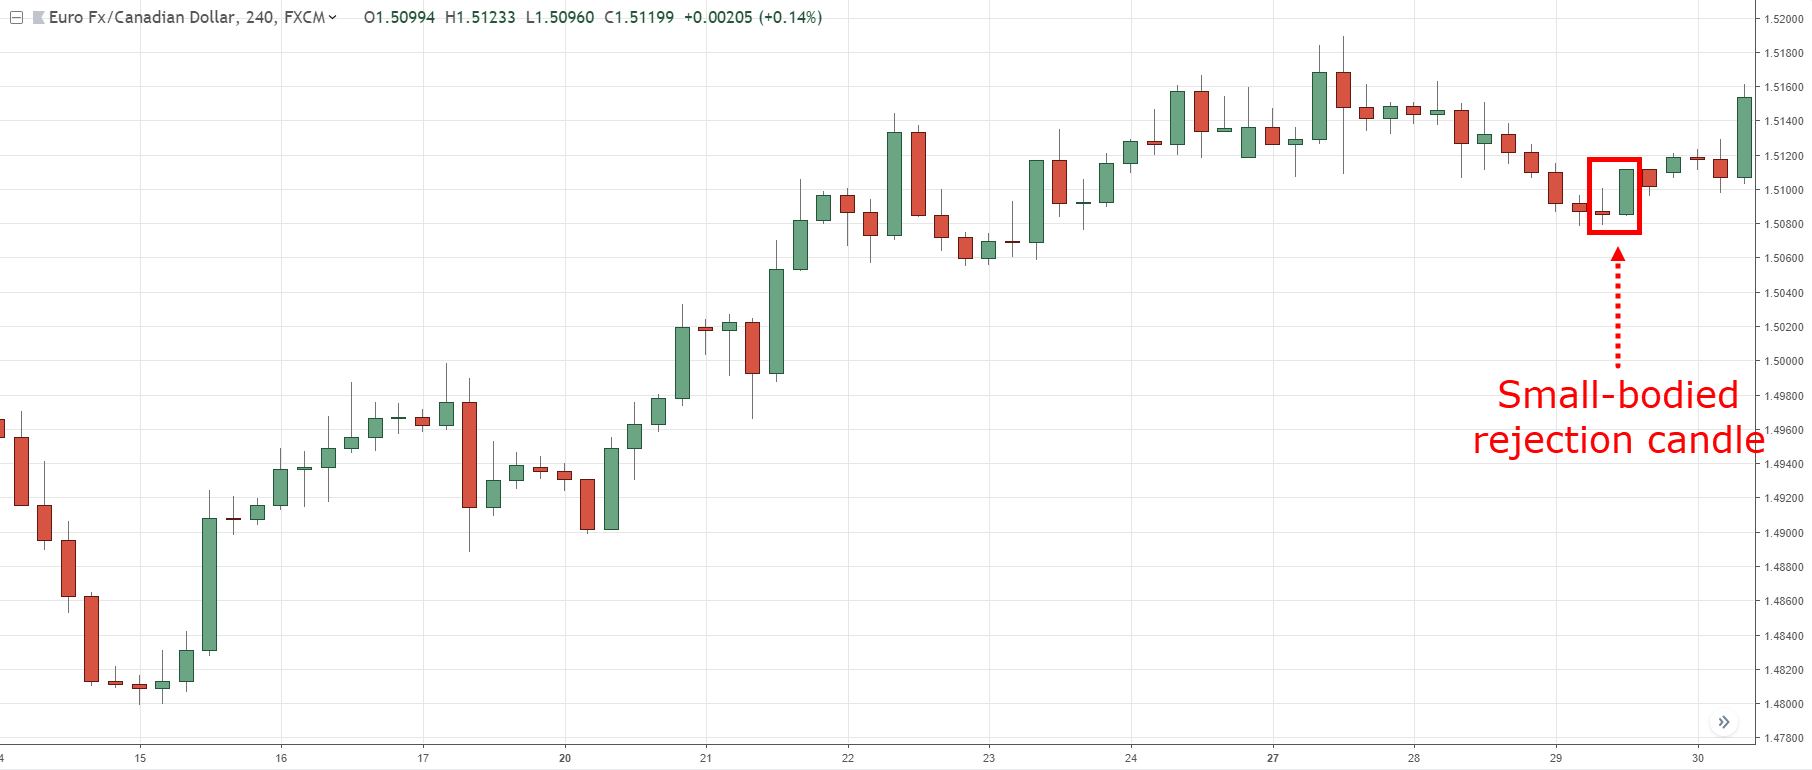
Retracement move
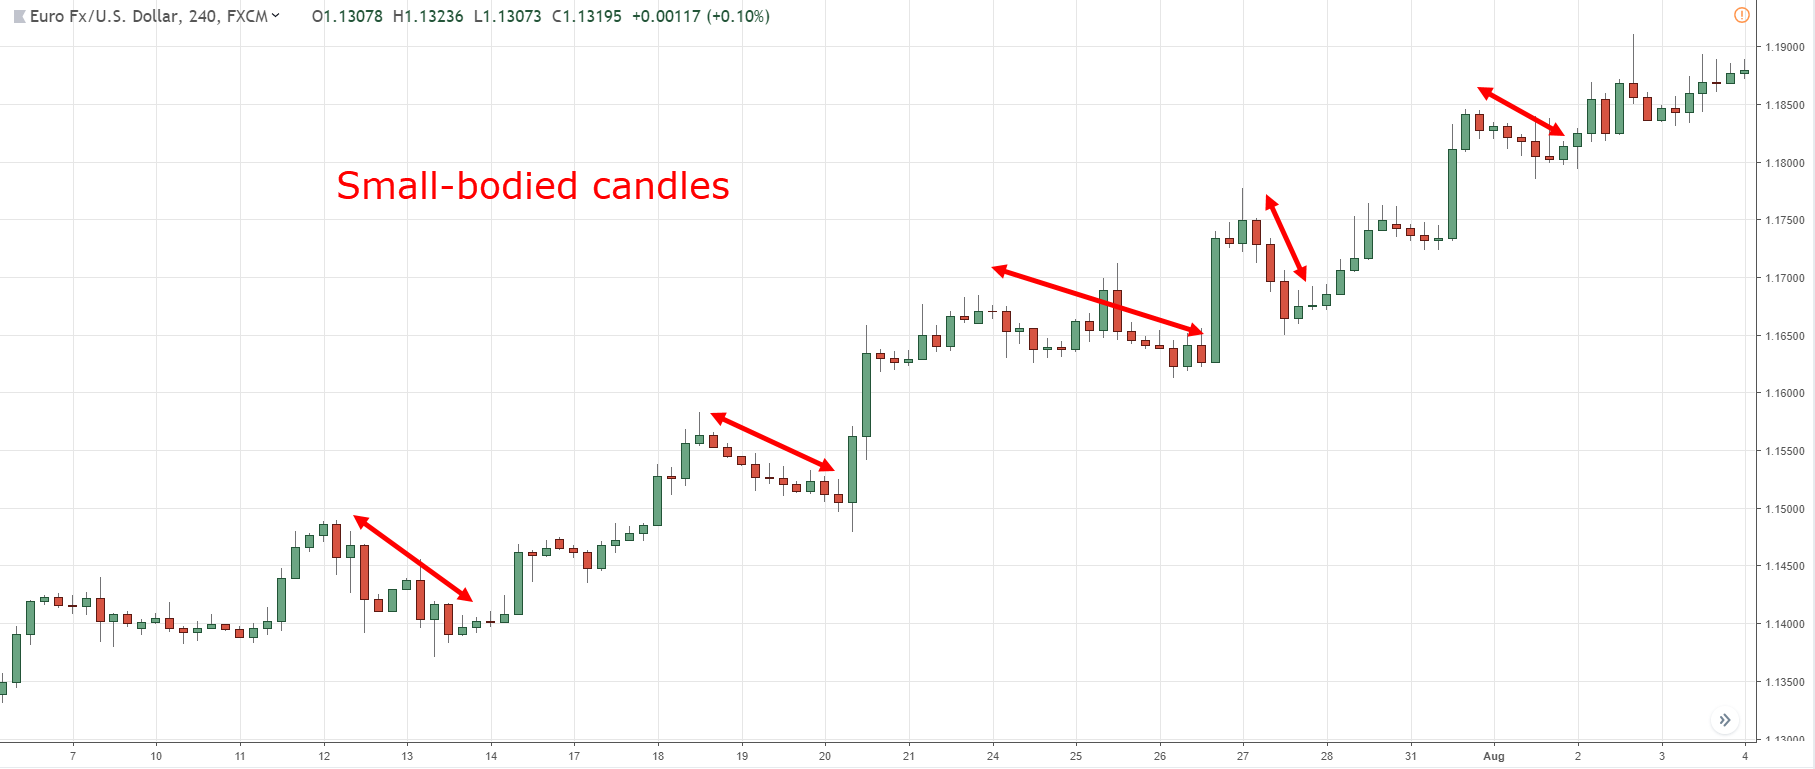
A retracement move is the “weaker leg of the trend.
You’ll notice small-bodied candles that move against the trend (otherwise known as counter-trend).
An example:
You might be wondering:
“Why is this important?”
Because in a healthy trend, you’ll expect to see a trending move followed by a retracement move.
But when the trend is getting weak, the retracement move no longer has small-bodied candles, but larger ones.
And when you combine this technique with market structure (like Support and Resistance, Trendline, etc.), you can pinpoint market turning points with deadly accuracy.
Let me give you an example…
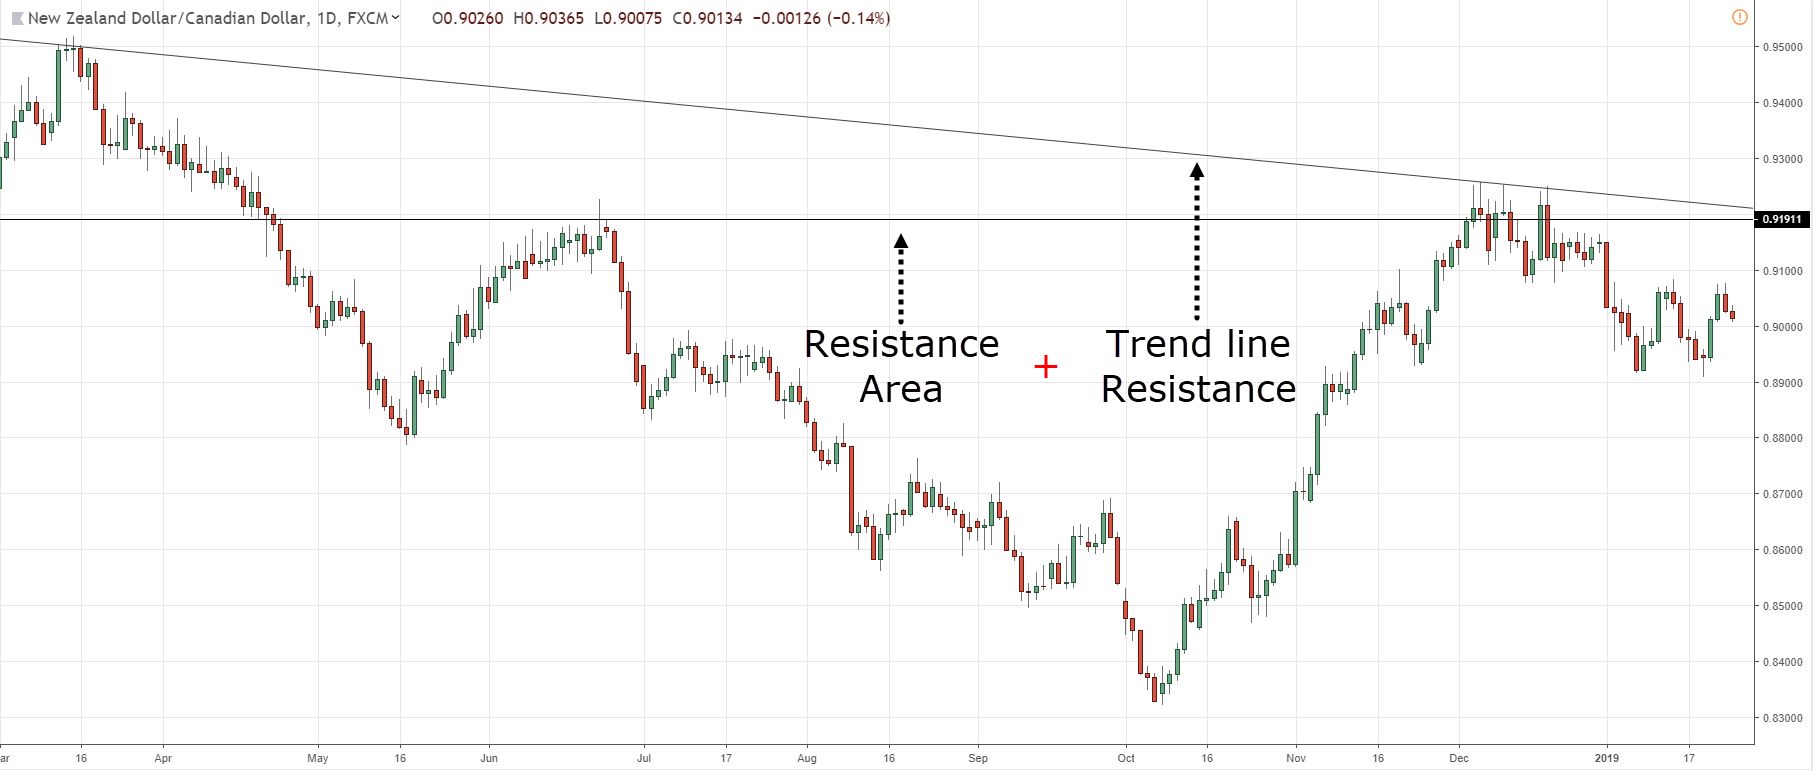
NZD/CAD Daily:
On the Daily timeframe, the price is at Resistance area and has a confluence of a downward Trendline.
The price could reverse lower so let’s look for a shorting opportunity on the lower timeframe…
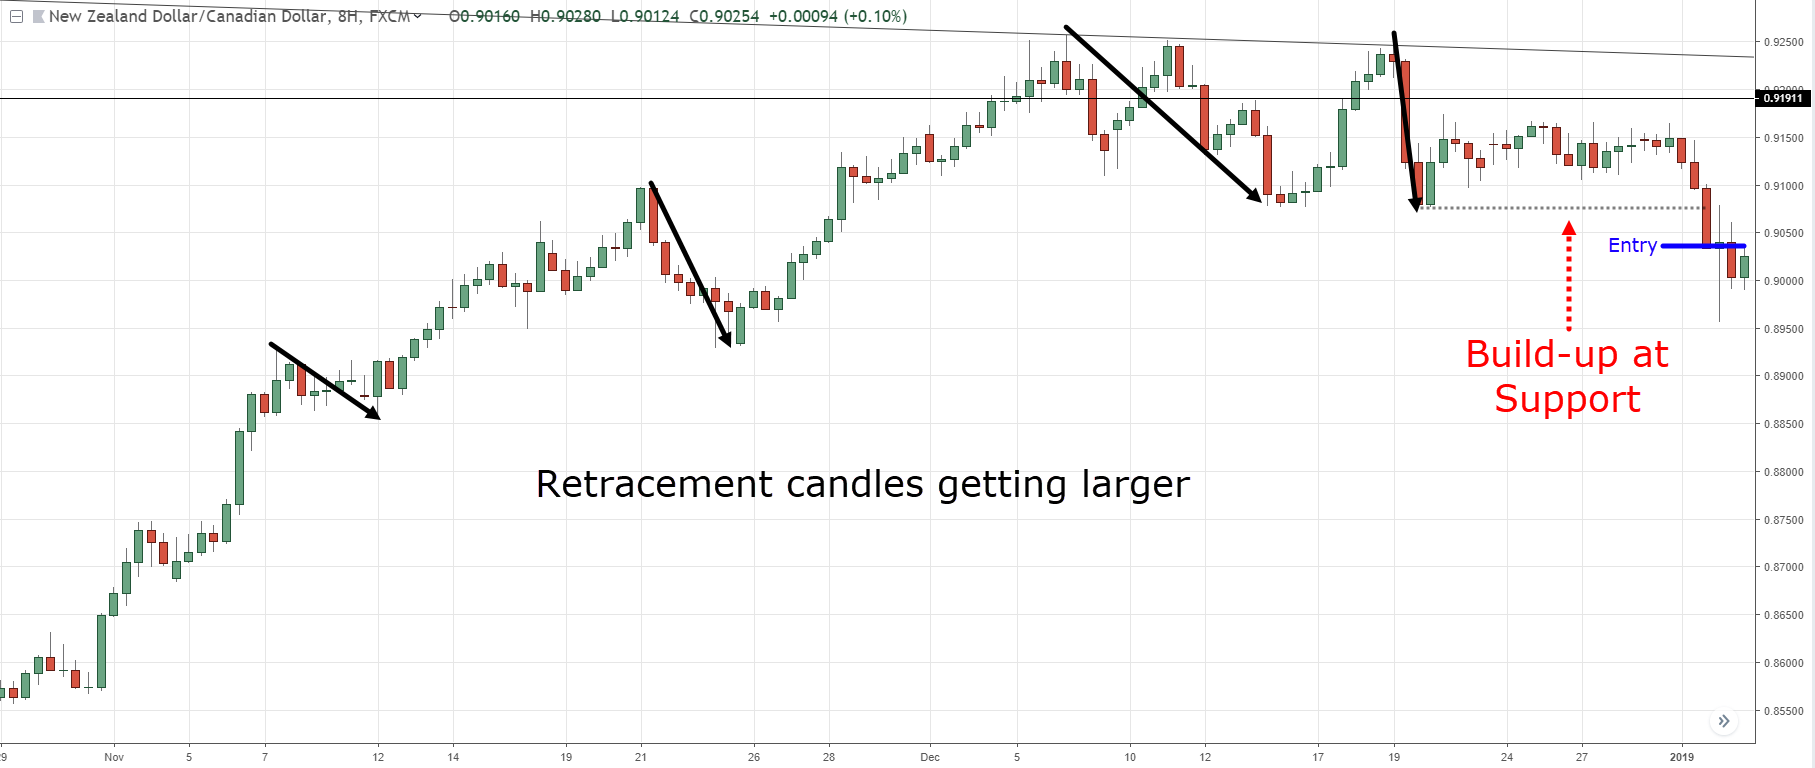
NZD/CAD 8-hour:
On the 8-hour timeframe, the selling pressure is coming in as you notice the candles of the retracement moves getting bigger (a sign of strength from the sellers).
Also, the buying pressure is getting weak as the candles of the trending move get smaller.
One possible entry technique is to go short when the price breaks and close below Support…
This is powerful stuff, right?
Frequently asked questions
#1: Is this guide applicable to all types of instruments or is it better suited to the Forex market?
The concepts in this guide can be applied to all markets with sufficient liquidity. This includes stocks, futures, bonds, etc.
#2: Are the candlestick patterns that you’ve mentioned earlier best suited for certain timeframes?
There’s no best timeframe to trade the candlestick patterns, it all boils down to your trading approach and the trading timeframe you’re on.
It doesn’t make sense to be looking at candlestick patterns on the daily timeframe if you’re a short-term trader entering your charts on the 15-minutes timeframe.
#3: Do you look at the news when you trade?
I don’t take into account news when I trade.
Because I believe all the news out there has already been expressed in the price of the market. And my trading strategy is developed ahead in time without accounting for news. If I were to follow the news instead of my trading strategy, then I’m no longer following my trading plan.
Look, if you don’t follow your trading plan and instead get affected by the news, then your actions are no longer consistent. And if you do not have a consistent set of actions, you’re not going to get a consistent set of results.
So, what’s next?
You’ve just learned that candlestick patterns give you an insight into the markets (like who’s in control, who’s losing, where did the price get rejected, and etc.).
However, you don’t want to trade candlestick patterns in isolation because they don’t offer an edge in the markets.
Instead, use them as tools to “confirm” your bias so it can help you better time your entries & exits.
Now… it’s time to put these techniques into practice.
The next step?
Click on the link below and download The Ultimate Guide to Price Action Trading.
You’ll get a beautiful PDF file that contains trading strategies and techniques that I’ve not shared in this post.
